The Ultimate Guide to Website Traffic Analytics
Why website traffic analytics is so very important?
Website traffic analytics helps you find out why your traffic increases or decreases, reveals the people behind the numbers in your website traffic reports, and shows the results of your marketing efforts and the efficiency of your advertising.
In this article, we briefly review tools, reports, and approaches to analyze your website traffic.
Contents
Simple Tools for Website Traffic Analytics
Simple website traffic analytics tools work thanks to tracking tags included in the code of each webpage. This code tracks a variety of events, collects data about those events as hits, and sends those hits for storage and processing. But even this approach has serious limitations:
- Hit size. The hit size is the volume of data collected on visitors’ website actions. If the hit size is too small, some data might not be collected, leaving you with a fragmented record of what’s happening on your site.
- Sampling. Free analytics tools often use data sampling while building reports, compromising the quality of decisions made based on those reports.
- Time delays. Typically, simple website traffic analytics tools collect a bunch of hits and only then send them to a data store. Because of this, it can take anywhere from a few hours to a few days to get updated data. This makes your analytics backward-looking and useful only for working on errors, not for taking immediate action or making future-oriented decisions.
In truth, simple website analytics tools are quite limited. Even the internationally known Google Analytics has most of the limitations we’ve mentioned. It’s really useful for beginners, but it can’t be the basis for serious analytics for websites with millions of visitors per day.
When your website traffic analysis becomes sophisticated, you need a bunch of additional features in your website analytics tool that allow you to:
- account for CRM data and product refunds;
- consider cost data for all advertising campaigns;
- choose from different built-in attribution models or build custom models;
- generate enhanced marketing reports like LTV, cohort, and ROPO.
Luckily, there are tools for enhanced website traffic analytics.
Tools for Enhanced Website Traffic Analytics
While performing website analysis, you’ll discover that you can’t analyze your website based on data collected from the site alone. To know for sure how high-quality your traffic is, how your advertising channels work, and what profit they generate, you need to add data from your CRM system and advertising accounts.
At this point, you can’t conduct your website analytics with one simple tool. You have no other option than heading towards a business intelligence (BI) setup. BI makes your business more controllable and allows you to make decisions that are data-informed or data-driven depending on your style of management.
So what features should an enhanced website traffic analytics tool have? We’ll show you an example.
OWOX BI was created to avoid the limitations of Google Analytics. After many years of development, it’s become a powerful AI-based personal marketing analyst used by many companies.
Like every enhanced analytics tool, OWOX BI performs four main BI processes: collect, store, merge, process, and report.

OWOX BI collects five kinds of data to make truly comprehensive reports: website data, cost data, offline sales data for offline stores, CRM data, and data from call centers. The number of custom reports you can build based on this huge amount of data is endless: LTV, ROPO, historical analysis, forecasting of sales plan performance.
Let’s see what basic and enhanced reports you need to analyze your website traffic and what tips and tricks you can use to deepen your understanding of it.
How to Effectively Analyze Your Website Traffic?
If you have no experience in analyzing your website and its traffic, keep in mind these essential steps.
Add Dimensions
Use dimensions (attributes of your data) to improve any basic report. Combine your metrics with the right dimensions to reveal insights for improving your website.
Let’s say we have a simple report on sessions and pages per session for traffic from different cities:
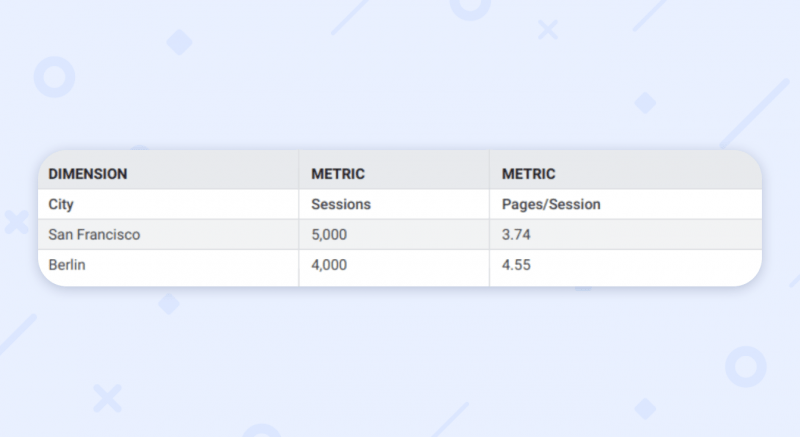
Let’s see what we get by simply adding another dimension:
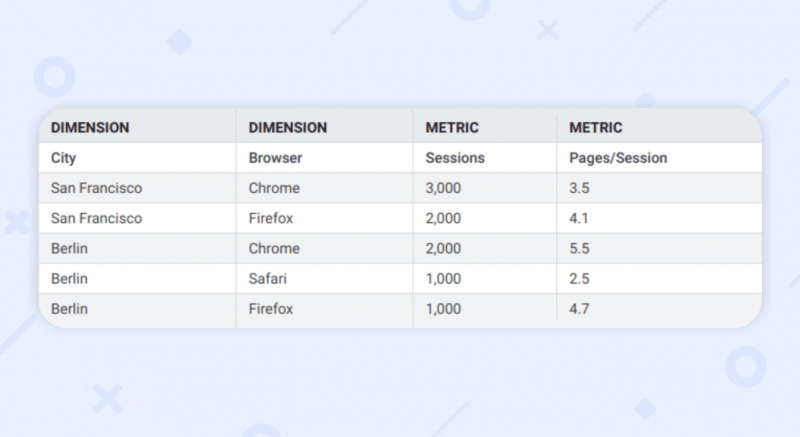
Voilà — by adding the browser dimension, we reveal a new fact about our website traffic: the browser influences the pages per session metric quite a lot even for people in the same city.
Segment Your Data
Segments help analysts compare parts against the whole. Comparing segments to other segments or to the whole data set is a simple way to analyze your traffic that might be useful for beginners.
In Google Analytics, you can add a segment to any report:
Try out these segments:
- Demographic — age, gender, city, etc.;
- Timestamp — before/after audiences;
- Platform/device;
- User type or buyer persona;
- Abandonment rate;
- Conversion rate;
- Content viewed;
- Industry.
You can also use segments for better remarketing, trigger emails, and special offer campaigns.
Basic Metrics and Reports
All traffic analytics is built on tracking the most essential marketing metrics in Google Analytics (or another tool of your choice). We’ll review a couple examples of the main groups of reports and metrics for most websites:
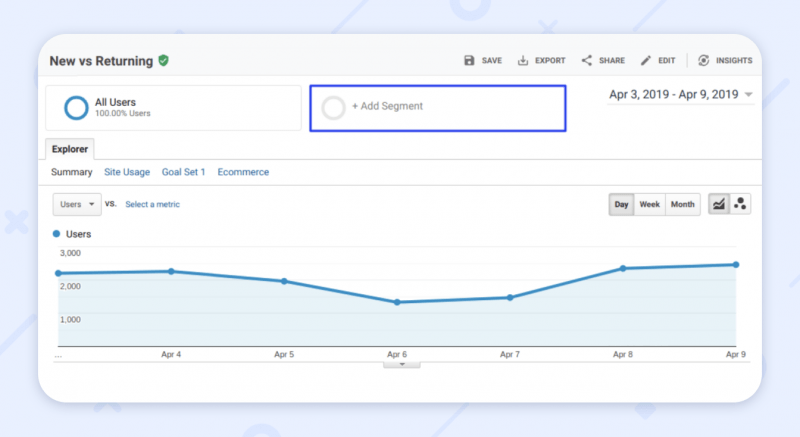
- Audience → Behavior → New vs Returning
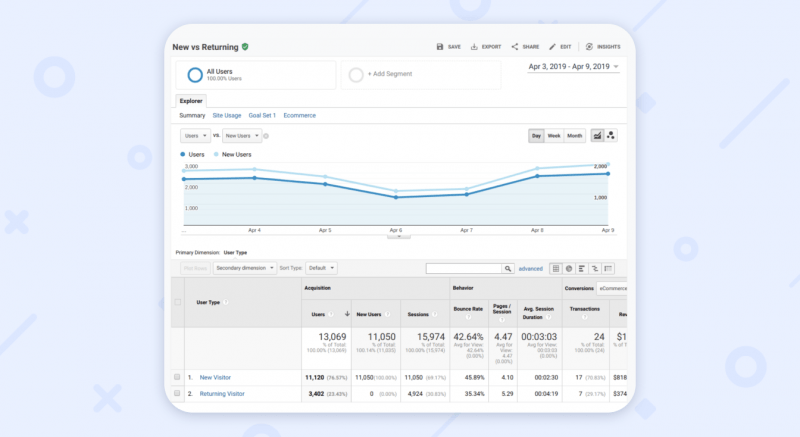
The New vs Returning report in Google Analytics will show you if your website audience is growing. If your number of new visitors is larger than the same metric from the previous period and larger than the number of returning visitors, you’ve definitely grown and your acquisition campaigns are working. On the other hand, if your number of returning visitors is higher than your number of new visitors, then your conversion and retention campaigns are performing well but you shouldn’t forget to grow your audience.
- Audience → Overview
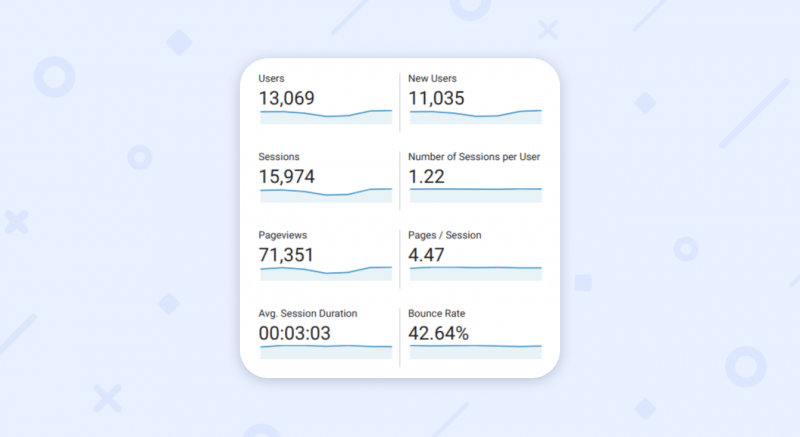
This group of metrics shows whether your visitors:
- are active and interested (Average Session Duration);
- are diving deep into your website (Pages / Session);
- find what they’re looking for immediately after they enter the website (Bounce Rate, etc.).
Also, you can see how page loading speed and the way your website is rendered on different devices influence your visitors’ behavior in the device and platform dimensions. The device/browser dimensions provide great insights for making improvements and improving the bounce rate, average session duration, and pages/session metrics will increase your overall website traffic and the overall quality of your site.
- Behavior → Site Content → Landing and Exit Pages
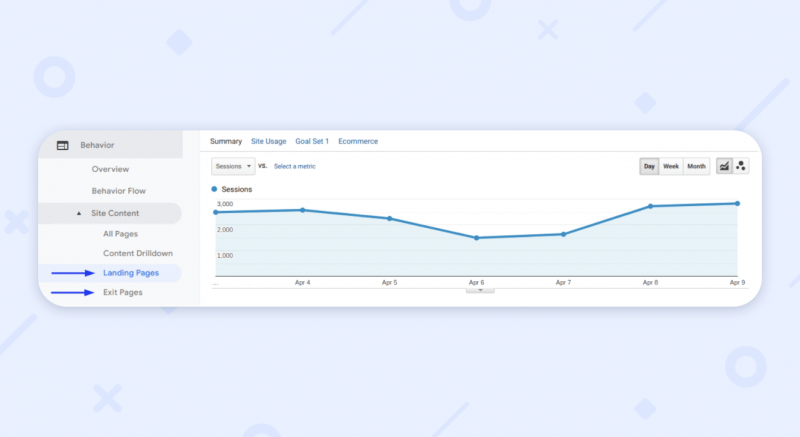
The Landing Pages and Exit Pages reports will reveal your most and least popular pages. You can then compare them to find out the main differences. These reports will also provide you with hints about how you can improve the situation.
- Conversions → Overview of Multi-Channel Funnel
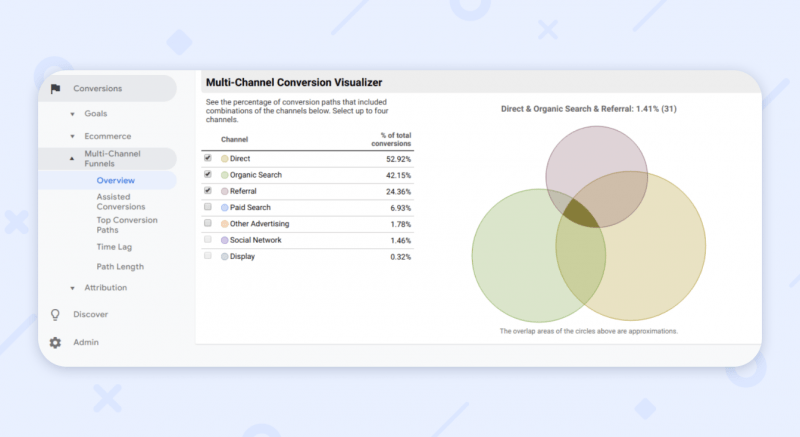
This report will help you find out the sequence of channels that visitors go through to get to a conversion. Thus, it describes the overall importance of each channel. If you see that your typical sequence has more than three channels, you should look for the perfect attribution model, as standard models overvalue one channel and undervalue others.
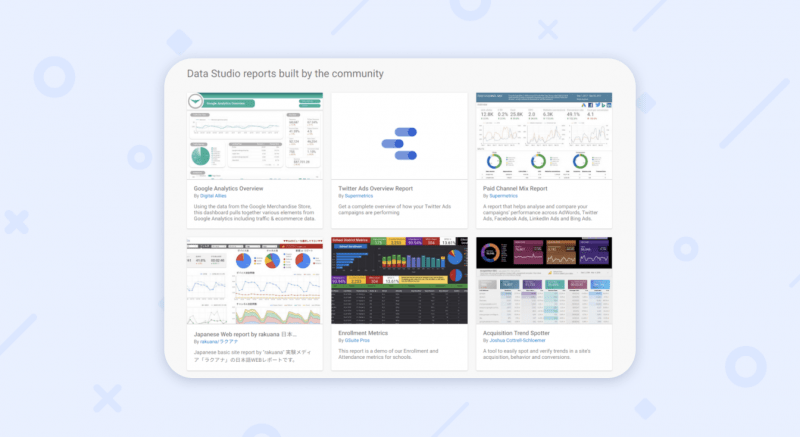
And for Dessert: Data Studio Templates
If you like to have all high-quality reports on one dashboard, try out these Data Studio Templates with different reports on your website traffic.